Prometheus is an open source monitoring system which is very lightweight and has a good alerting mechanism.
Install and Configure Prometheus
This guide explains how to install and configure the latest Prometheus on a Linux VM.
If you would like to install Prometheus on a Kubernetes cluster, please see the Prometheus on kubernetes guide.
Before You Begin
- Ensure that you have sudo access to the Linux server because the commands used in this guide require elevated privileges.
- The server has access to the internet for downloading Prometheus binary.
- Most importantly, firewall rules opened for accessing Prometheus port 9090 on the server.
Setup Prometheus Binaries
Step 1: Update the yum package repositories.
sudo yum update -y
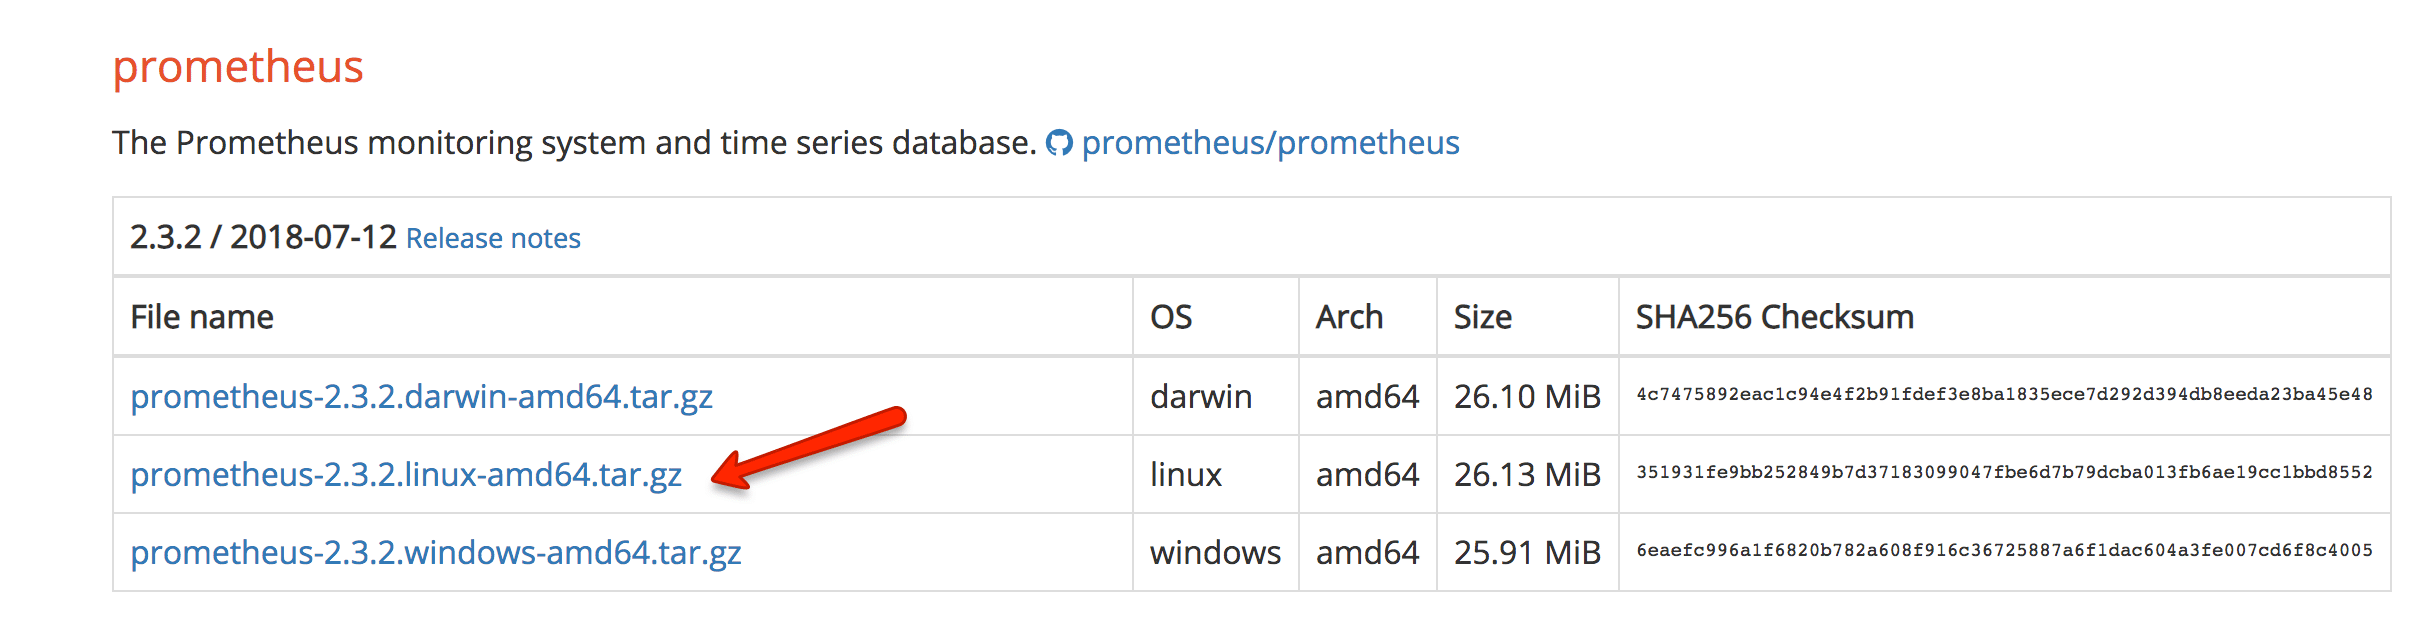
Step 2: Go to official Prometheus downloads page and get the download link for Linux binary.
Step 3: Create a Prometheus user, required directories, and make prometheus user as the owner of those directories.
sudo useradd --no-create-home --shell /bin/false prometheus
sudo mkdir /etc/prometheus
sudo mkdir /var/lib/prometheus
sudo chown prometheus:prometheus /etc/prometheus
sudo chown prometheus:prometheus /var/lib/prometheus
Step 4: Download the source using curl, untar it and rename the extracted folder to prometheus-files.
curl -LO https://github.com/prometheus/prometheus/releases/download/v2.3.2/prometheus-2.3.2.linux-amd64.tar.gz
tar -xvf prometheus-2.3.2.linux-amd64.tar.gz
mv prometheus-2.3.2.linux-amd64 prometheus-files
Step 5: Copy prometheus and promtool binary from prometheus-files folder to /usr/local/bin and change the ownership to prometheus user.
sudo cp prometheus-files/prometheus /usr/local/bin/
sudo cp prometheus-files/promtool /usr/local/bin/
sudo chown prometheus:prometheus /usr/local/bin/prometheus
sudo chown prometheus:prometheus /usr/local/bin/promtool
Step 6: Move the consoles and console_libraries directories from prometheus-files to /etc/prometheus folder and change the ownership to prometheus user.
sudo cp -r prometheus-files/consoles /etc/prometheus
sudo cp -r prometheus-files/console_libraries /etc/prometheus
sudo chown -R prometheus:prometheus /etc/prometheus/consoles
sudo chown -R prometheus:prometheus /etc/prometheus/console_libraries
Setup Prometheus Configuration
All the prometheus configurations should be present in /etc/prometheus/prometheus.yml file.
Step 1: Create the prometheus.yml file.
sudo vi /etc/prometheus/prometheus.yml
Step 2: Copy the following contents to the prometheus.yml file.
global:
  scrape_interval: 10s

scrape_configs:
  - job_name: 'prometheus'
    scrape_interval: 5s
    static_configs:
      - targets: ['localhost:9090']
Step 3: Change the ownership of the file to prometheus user.
sudo chown prometheus:prometheus /etc/prometheus/prometheus.yml
Setup Prometheus Service File
Step 1: Create a prometheus service file.
sudo vi /etc/systemd/system/prometheus.service
Step 2: Copy the following content to the file.
[Unit]
Description=Prometheus
Wants=network-online.target
After=network-online.target

[Service]
User=prometheus
Group=prometheus
Type=simple
ExecStart=/usr/local/bin/prometheus \
    --config.file /etc/prometheus/prometheus.yml \
    --storage.tsdb.path /var/lib/prometheus/ \
    --web.console.templates=/etc/prometheus/consoles \
    --web.console.libraries=/etc/prometheus/console_libraries

[Install]
WantedBy=multi-user.target
Step 3: Reload the systemd service to register the prometheus service and start the prometheus service.
sudo systemctl daemon-reload
sudo systemctl start prometheus
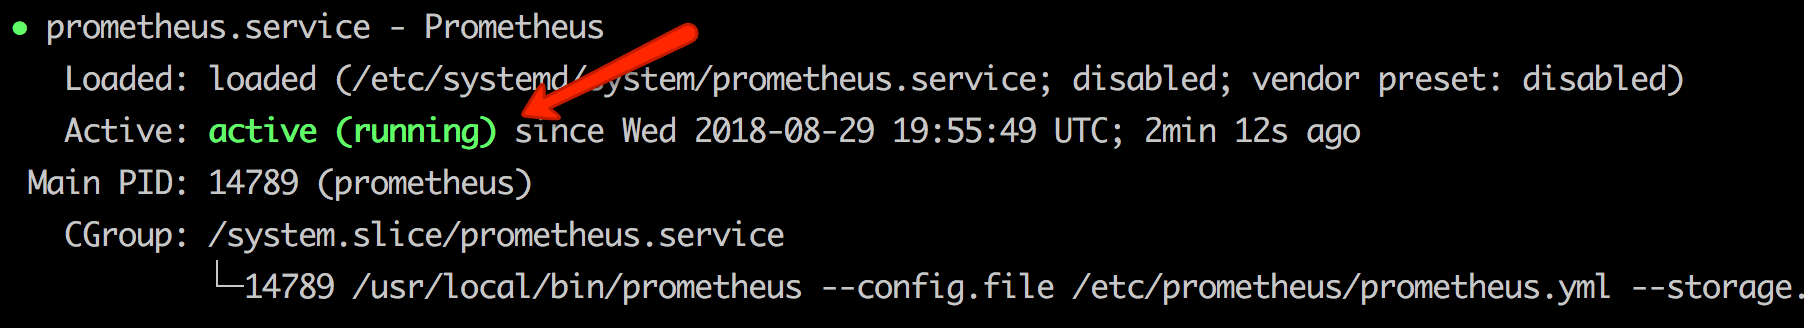
Check the prometheus service status using the following command.
sudo systemctl status prometheus
The status should show the active state as shown below.
Access Prometheus Web UI
Now you will be able to access the prometheus UI on 9090 port of the prometheus server.
http://<prometheus-ip>:9090/graph
You should be able to see the following UI as shown below.
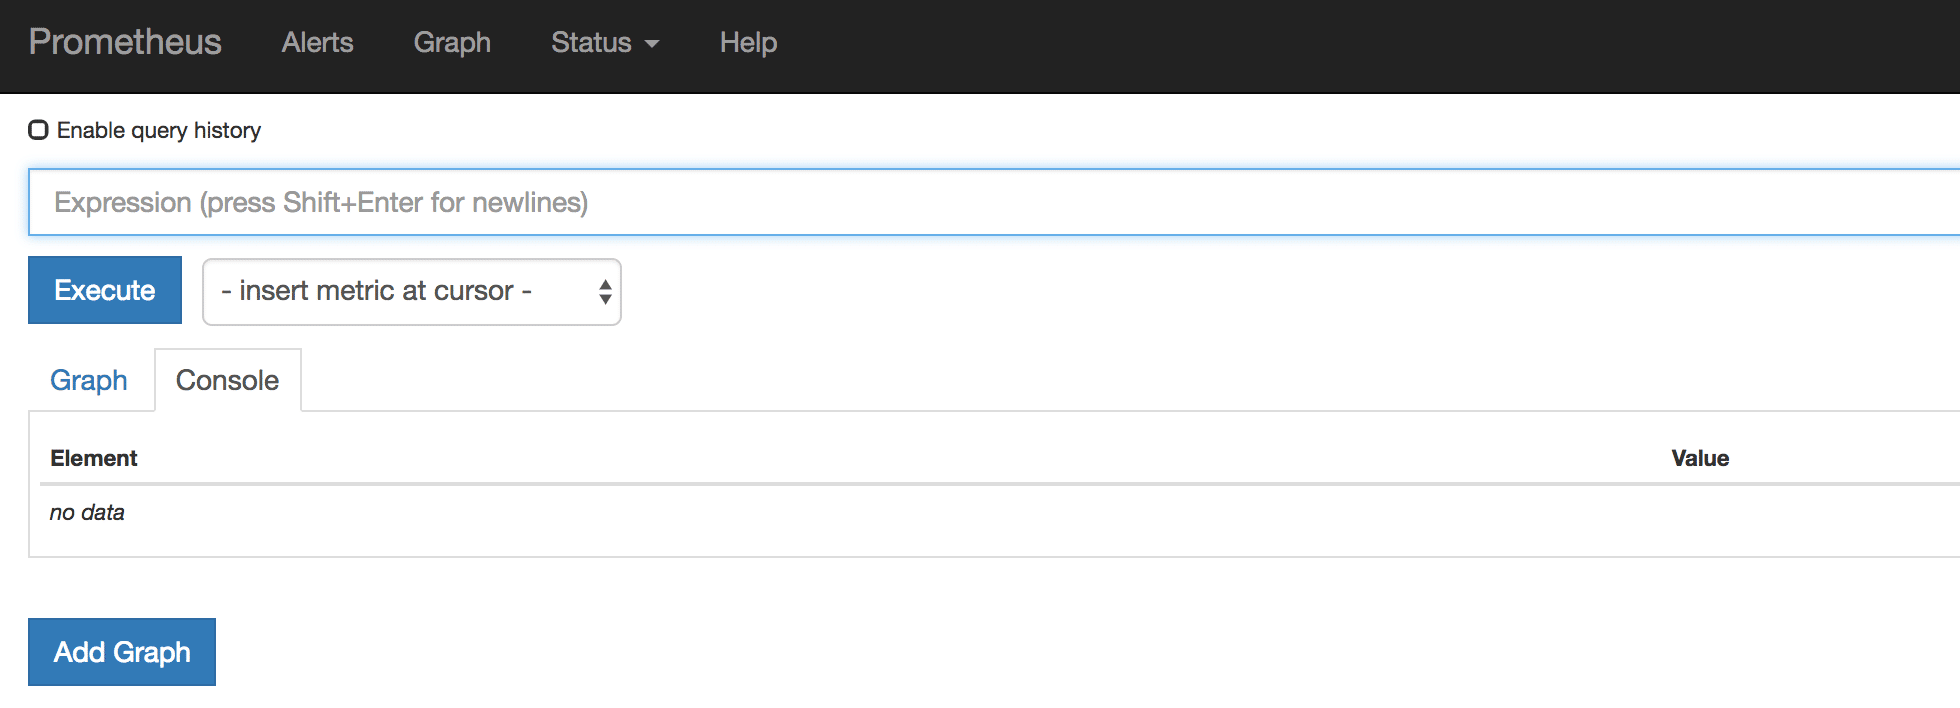
Right now we have just configured prometheus. You need to register the target in the prometheus.yml file to get the metrics from the source systems.

ONLINE COURSE: Monitoring and Alerting with Prometheus
Monitoring and Alerting of your infra and apps using the leading open-source monitoring system. Visualize using Grafana
- Learn to setup and configure prometheus
- Learn to setup alerting on prometheus
- Configure grapahana for visualizing the monitoring data.
- Learn to instrument application for prometheus monitoring.
- Understand monitoring and alerting setup for your whole infrastructure.
The post How To Install and Configure Prometheus On a Linux Server appeared first on DevopsCube.
Comments
Post a Comment